YOUR DOLLARS AT WORK
Council remains committed to achieving affordable taxes while maintaining and expanding high quality services for residents. By taking a long-term 10-year view in our budget development, Council strives to proactively tackle the challenges facing our residents and seize upon opportunities that will improve our residents’ lives. Since understanding budgets can be a daunting task, we prepared an informative video in 2020 to help you understand a bit of the process that Council undertakes each year to ensure you are receiving the best quality services at affordable tax rates.
In 2020 Council committed to adding $47 million in incremental capital spending to improve the condition of our roads and bridges. The plan that was developed and approved to fund this significant investment was an increase in planned debt of $25 million and a 3.6% increase in taxes on an average property or a $37 increase on an average household.
The charts below show you the detail of how your money is being spent.
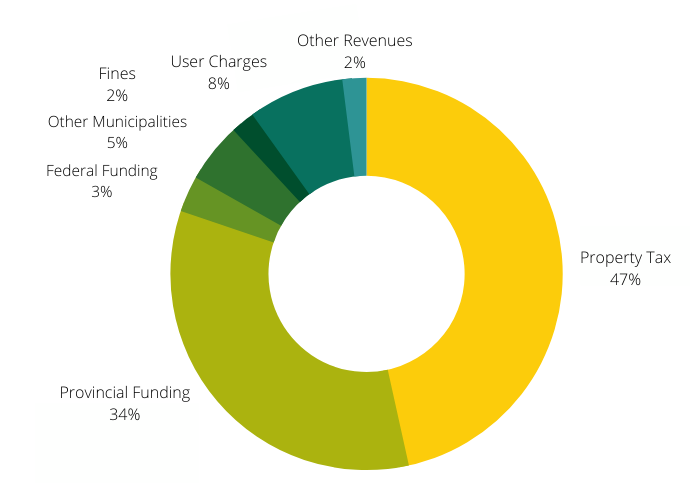
Revenues (in Millions)
The vast majority of revenue is derived from property tax revenue and transfer payments from the provincial and federal governments. Prior to 2012 transfer payments were higher than tax revenue but that has changed dramatically since annual OMPF (Ontario Municipal Partnership Fund) payments have been reduced by $5 million. Now almost half of County revenue is from property taxes and a little over one-third is from transfer payments. User charges, such as those for Long-Term Care, combined with inter-municipal payments and fines account for the rest of the revenue collected.
| Revenue | Budget | Actual | Percent |
| Property Tax | (39,200,967) | (39,737,672) | 47% |
| Inter-Governmental Funding | |||
| Federal Funding | (2,482,621) | (2,521,692) | 3% |
| Other Municipalities | (4,071,275) | (3,903,300) | 5% |
| Provincial Funding | (28,257,754) | (29,140,165) | 34% |
| User Charges and Fines | |||
| Fines | (2,058,846) | (1,449,017) | 2% |
| User Charges | (7,152,294) | (6,797,898) | 8% |
| Other Revenues | (1,654,132) | (1,787,423) | 2% |
| Grand Total | (84,877,888) | (85,337,166) | 100% |
| Surplus | 459,278 |
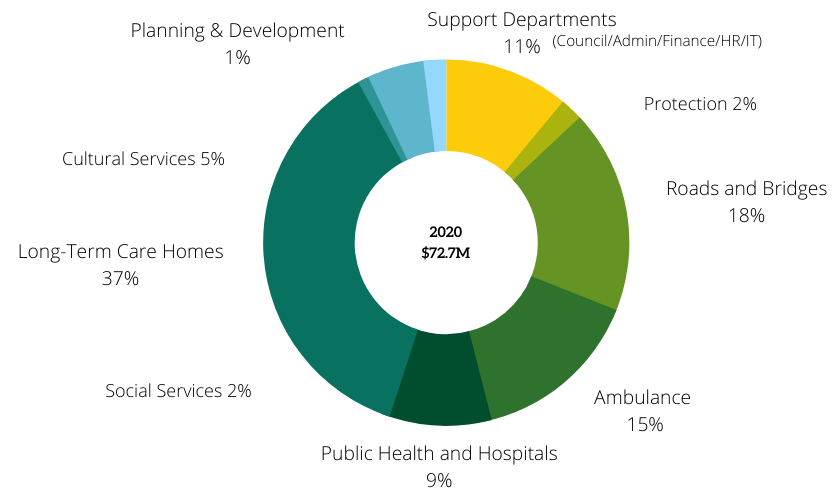
Expenditures (in Millions)
Wages and benefits account for over 40% of expenditures, with the vast majority of that occurring at the long-term care homes. Contracted services and materials combined account for a further 40% of cost, with the contracting out of Ambulance services being the most significant component. Amortization accounts for 15% of the total expenses, with this sector being dominated by roads and bridges. In simple terms, amortization is an allocation (based on life cycle) of capital expenditures from previous years. You can read more on capital expenditures in the next section.
| Service | Budget | $ Actual | % Actual |
| Long-Term Care Homes | 27,018,075 | 27,045,181 | 37% |
| Roads and Bridges | 13,370,838 | 12,920,463 | 18% |
| Ambulance | 11,227,378 | 11,249,196 | 15% |
| Support Departments (Admin/Council/Finance/HR/IT) | 8,009,459 | 7,916,435 | 11% |
| Public Health & Hospitals | 6,195,244 | 6,303,723 | 9% |
| Cultural Services | 3,861,446 | 3,321,152 | 5% |
| Social Services | 2,464,103 | 1,726,153 | 2% |
| Protection Services | 1,855,720 | 1,186,903 | 2% |
| Planning and Development | 1,684,373 | 1,079,109 | 1% |
| Grand Total | 75,686,638 | 72,748,315 | 100% |
| Surplus | 2,938,323 |
Capital expenditures are an investment in the County’s infrastructure, such as roads, bridges, buildings and equipment. The amount invested in any given year can vary dramatically from year-to-year. The current Terrace Lodge redevelopment project is an excellent example of why capital expenditures have variability from year-to-year. The Terrace Lodge redevelopment project is over $30 million, but this type of large investment only happens every 40 years. Similarly bridges also have a long life span with 50-80 years between major reconstruction projects. Because of this variability in annual capital expenditures, it does not make sense for these large projects to be paid for just from current tax revenue. That is why reserves and debt are required, but more on that later.
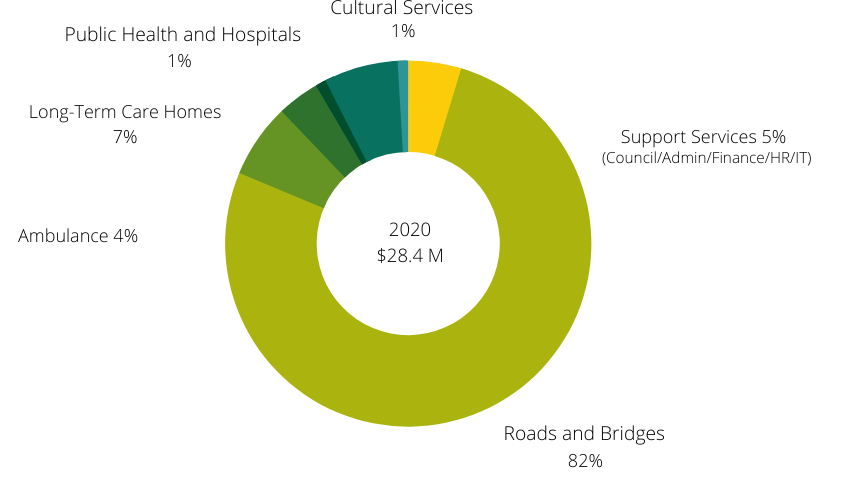
| Capital | Budget | $ Actual | % Additions |
| Roads and Bridges | 25,557,489 | 23,406,635 | 82% |
| Long-Term Care Homes | 2,226,961 | 1,891,136 | 7% |
| Support Departments (Council/Admin/Finance/HR/IT) | 1,696,801 | 1,342,766 | 5% |
| Ambulance | 1,215,080 | 1,229,795 | 4% |
| Cultural Services | 351,537 | 343,551 | 1% |
| Public Health & Hospitals | 201,164 | 1% | |
| Grand Total | 31,047,868 | 28,415,047 | 100% |
| Surplus | 2,632,821 |
Net Spend
Net spending represents the County’s total expenditures less funding from external sources (non-tax revenues). In other words, it represents the amount County rate payers have, are or will be contributing to expenditures through the levy. Because reserves and debt can be used to fund some of the expenditures today, current tax payments do not fund all the net spend. Past tax payments have funded reserves and future tax payments will have to go toward repaying the debt, so ultimately all the net spend is funded by past, current and future tax payments. You can read more about this in the next section.
In the attached charts, net spending is divided by the number of households in Elgin County to reach the average amount of net spend per household. For 2020 this amount was $1,676 per household. As mentioned in the prior paragraph, the 2020-year net spend will not be entirely funded by 2020 taxes.
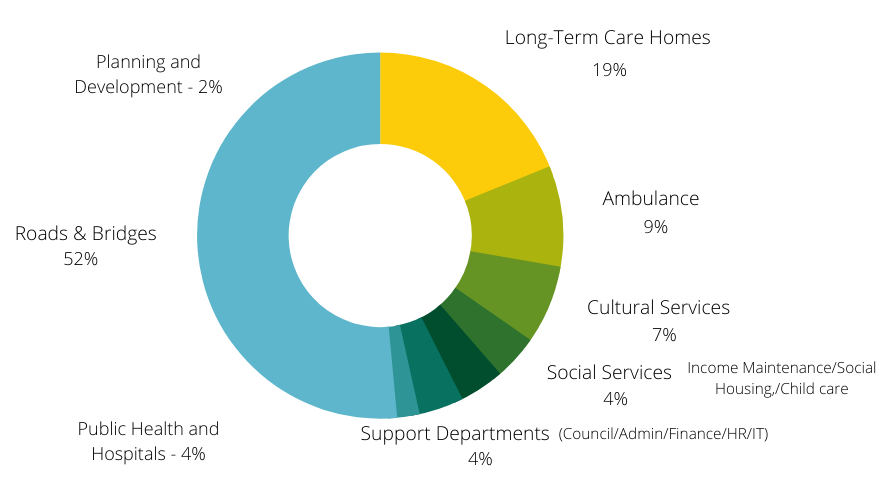
| Per Household | |
| Transportations Services | $ 869 |
| Senior Services | $ 317 |
| Ambulance | $ 149 |
| Cultural Services | $ 110 |
| Social Services | $ 65 |
| Public Health & Hospitals | $ 61 |
| General Government | $ 71 |
| Planning and Development | $ 33 |
| $ 1,676 |
How is it all Funded?
The net of revenue and expenditures is the change in economic resources available to the County and thereby results in a change in the accumulated surplus. Changes in accumulated surplus result in changes in the amount invested in our infrastructure and/or changes in reserves. To learn more about investments in infrastructure, read the “Capital Expenditures” section of this Annual Report.
Reserves are similar to savings that you set aside for your own household. Those savings can be used in case of emergencies, but you may also be saving money to pay for a future investment such as a new car or house. The money that County Council sets aside in reserves has the same purpose, but instead of a car or a home, Elgin County is setting aside money for things such as bridges and Long-Term Care Home redevelopment.
The money you have set aside as savings will likely be insufficient to buy a new house today, but you can get a mortgage to help you make that purchase. You will be repaying that loan over time, so ultimately you will be paying for the entire cost of the house. Similarly, the County can borrow money for a large project such as the Terrace Lodge redevelopment and then repay that debt over time with future tax revenues.
In 2020, the average property contributed $1,501 but it is important to note that tax contributions are based on property value assessment and some households will pay less than the average and others will pay more.
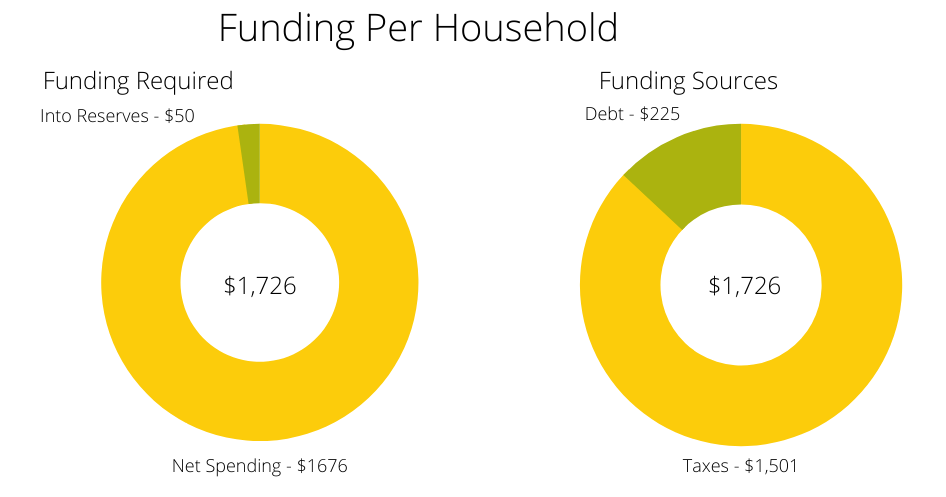
| Per Household | |
| Net Spend | $ 1,676 |
| Into Reserves | $ 50 |
| Total Funding Required | $ 1,726 |
| Taxes | $ 1,501 |
| Debt | $ 225 |
| Out of Reserves | $ – |
| Total Funding Received | $ 1,726 |